 Enhancements
to Version 2.03 released 23 February 2007
Enhancements
to Version 2.03 released 23 February 2007
The most important enhancements released in Version 2.03 include:
o MIG1 form changes to related to identifying the implementing agent, the introduction of sub-places to describe the location of a project and validation of unit costs.
o A new summary backlog reporting module that provides a platform for capturing and reporting backlog information at municipal level.
o A new reporting module that includes GIS functionality to provide a spatial view of MIG projects and thematic layers of MIG expenditure and service delivery backlogs.
MIG1 form changes
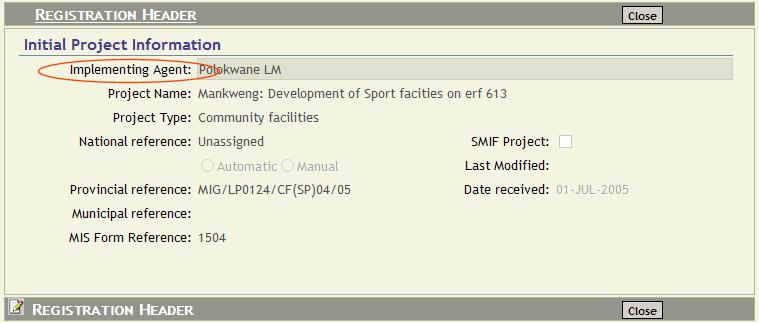
Registration header
On the Registration Header section, the field previously labeled “Municipality” now reads “Implementing Agent”. All aspects of the location of a project are now dealt with in Section 3.5. Note that the Implementing Agent can be a district municipality
To positively locate a project, the fields “Nearest Business Centre” and “Distance to Business Centre” have been replaced with the Sub-place name and a validation to confirm that the coordinates specified are indeed within the boundaries of the Sub-place. Note that the latitude degrees are negative to indicate that the project is in the Southern Hemisphere.
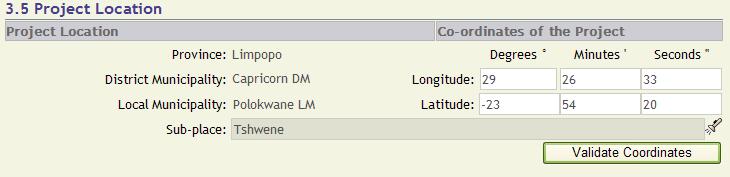
Click Validate Coordinates button to find out whether the coordinates you entered fall within the sub-place. If you are unable to supply coordinates that match the sub-place, you will be able to save the form but you will not be able to submit the form into the workflow until matching coordinates have been supplied.
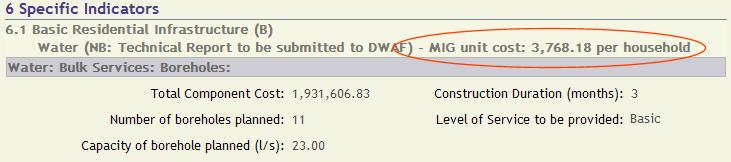
Section 6: Unit cost validation
As from version 2.03, the unit-cost of outputs are validated against the National Guidelines as specified in “Basic Level of Services and Unit Costs: A guide for municipalities – December 2005”. The National Guidelines do not specify unit costs for all outputs, but where possible the MIS will calculate the unit cost of the component in the units specified by the guidelines (for example per household, per km, etc.) For projects that do not involve counter funding the component cost is taken as MIG funding and the unit cost can be accurately assessed. For projects that do involve counter funding the MIS calculates a MIG Funding Ratio from Section 3.4.1 can only assume that this ratio of MIG Funding to Total Funding applies to all component costs. Since this may not always be the case you will be requested to provide a motivation whenever the MIS finds a component cost that exceeds the guidelines.
Please note that the unit cost validations will not prevent a form from being recommended by users participating in workflow process. It merely alerts the data capturer of the fact, allows a motivation or explanation to be entered and alerts al subsequent workflow participants of the irregular unit cost, who may accept the explanation or refer the form back for revision.
![]()
Summary backlog reporting module
The new summary backlog-reporting module is developed within the MIG-MIS and will provide a facility or platform to capture backlog information at municipal level. At present sector departments supply the best available backlog information and this information is not quality assured at municipal level.
Benefits of the Backlog Reporting Module
The Backlog Reporting Module provides the following benefits and opportunities:
o A platform or facility for municipalities to capture backlog information at local level;
o Creates a culture of capturing local information at the source or community level.
o Municipalities take ownership in capturing and maintaining backlog data within their respective municipal areas;
o Baseline for service delivery is accessible via the MIG-MIS:
o Census data after re-determination in January 2006 is provided.
o Sector baseline for water, sanitation and electricity is provided.
o Municipal baseline for 2007 will be progressively developed as the municipality captures their backlog perspective on the MIG-MIS
o All decision makers and personnel working with service delivery data will have three perspectives of the data namely;
o Census data view per municipality;
o Sector perspective;
o Municipal perspective
o The MIG-MIS will play a crucial role in providing a facility where the data provided by the respective data custodians are maintained by the respective data custodians. In this way responsibility and accountability for information is maintained and encouraged amongst the respective data custodians.
o Once-off data audits can be captured on the MIG-MIS by municipalities and can be used as a baseline by the municipalities. This will ensure that backlog studies commissioned by individual municipalities across the country are on-line and contribute to a municipal baseline.
For a more detailed description of features please refer to the Online Help under Reference/Backlogs.
Reporting, Mapping and Graphing
Module
The new reporting, mapping and graphing module allows you to now generate on screen reports, maps and in the future also graphs.
The GIS module provides a spatial view of MIG registered projects, thematic layers for MIG expenditure and service delivery backlogs. At present the capability of the GIS module is confined to the display of thematic layers. In the next phase of development the updating of spatial information at community level will be possible.
Benefits of the GIS Module:
o All the data that resides in the MIG-MIS is spatially enabled.
o The geographic spread of MIG registered projects in relation to other entities can be analysed.
To generate a report or map:
1. Click Reports on the Application Menu. (Note that the old reports in the Project Lifecycle and Funding Administration applications will still be available for a few weeks, after which they will be removed).
2. Select a report topic of your choice.
3. Optionally specify filter parameters to restrict your report to a specific Agency, Project Type, Project Status, etc.
4. Click Report or Map on the Action Bar.
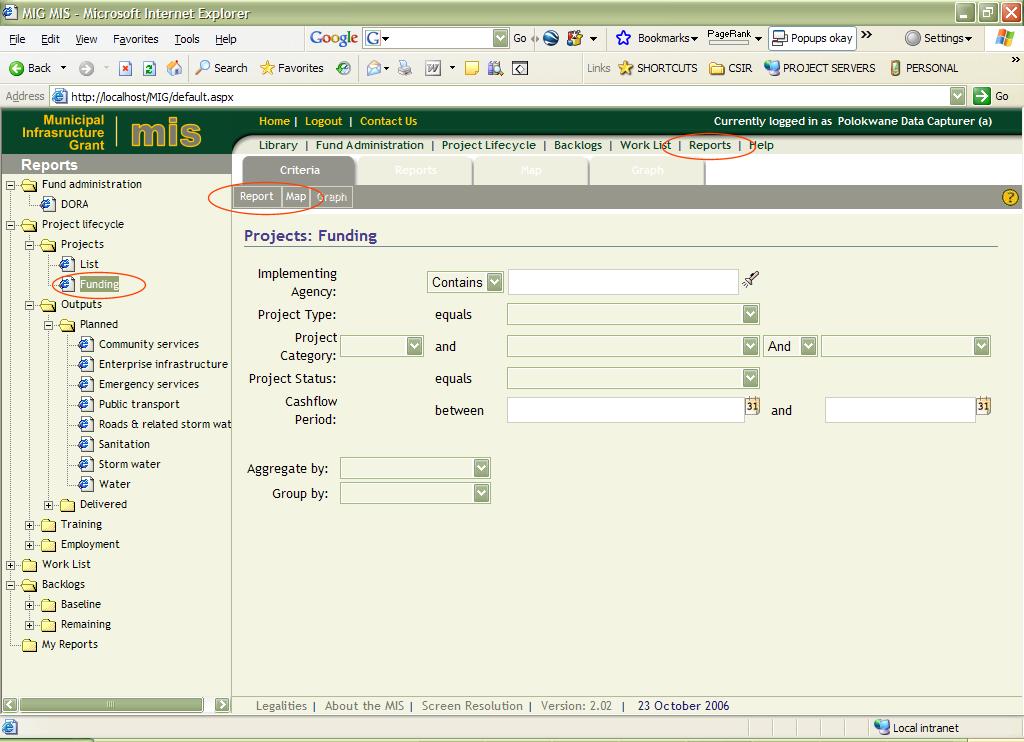
If you want to adjust the filter criteria after looking at the Report or Map, click the Criteria Tab, adjust the criteria and click Report or Map on the Action Bar.